Liven Up Your Training Programs With Infographics
 Brain is capable of absorbing 36,000 images every minute and almost 90% of the information absorbed by the brain comes through the eyes. Stemming from these facts, today visual information such as pictures, drawings or dynamic videos is often designed to facilitate learning and instruction. These visuals improve cognition by utilizing information, enhance the effectiveness of the learning process and make it easier for the users to remember the details of the subject.
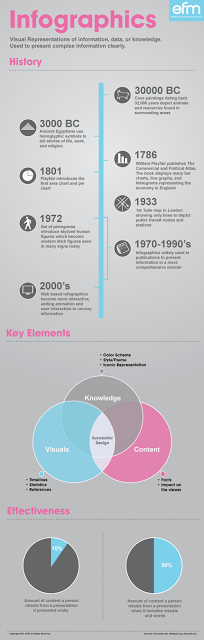 Infographics, in other words information graphics, are a new form of visual representation that intends to represent complex data in a simple and clear way. In the recent years, I have seen many good examples of infographics and can say that it will become an essential tool for training programs.
Infographics have been around for many years and recently the proliferation of a number of easy-to-use, free tools have made the creation of infographics available to a large segment of the population. Today individuals use the social media to spread the ones they prepare. In newspapers, infographics are commonly used to show the weather and graphs for statistical data. For information on the history of this tool please see the infographics below or visit the following link http://bit.ly/16TpmAo
For successful infographics there are two main dimensions that we need to consider:Content & Design. For a successful design; Jason Oberholtzer suggests the following in his article broadcasted at Forbes’ website:
The infographics should have a structured content with a beginning, middle and end.
- Pick relevant images to your content.
- Simplify the text and the illustrations.
- Limit the focus to just one area.
- Label time sensitive data to make it credible.
If you would like to design your own infographics, there are many web-based tools available on the internet. My favorite tool is http://piktochart.com/ For a more comprehensive list of free tools to make infographics please see Angela Alcorn’s article .
Infographics is a good tool to break the training content into parts and then visualize it. In a sense; they are like PowerPoint slides but more colorful and structured ones. Please see the following two examples which are on learning and learning methods.
http://bit.ly/xXwHLF
http://bit.ly/17rboJq
You should consider using these visuals in your training documents, slides and trainings developed for e-learning to color up your programs and for more creative content. You can prepare student notes of a training program you deliver as infographics or you can prepare your slides especially that contain intense data by using this method.
Resources
E-learning blogs. Retrieved 09 25, 2013, from Articulate: http://www.articulate.com/rapid-elearning/how-can-infographics-produce-better-e- learning-courses/
Hyerle, D. (2000). Thinking Maps: Visual Tools for Activating Habits of Mind. In D. Hyerle, Learning and Leading with Habits of Mind (pp. 150-153).
Infographic. Retrieved 09 27, 2013, from Wikipedia: http://en.wikipedia.org/wiki/Infographic
Kumar, S. Infographics and Learning. Retrieved 09 26, 2013, from Learnnovators: http://learnnovators.com/infographics-learning/
Oberholtzer, J. Retrieved 09 28, 2013, from Forbes: http://www.forbes.com/sites/jasonoberholtzer/2012/09/18/today-in-horrible-infographics-5-keys-to-creating-successful-infographics/